
Visually analyzing large (digital) image collections
Author:
Sophie Mélix
Citation:
Mélix, S. (2024): Sketching and Mapping Rendering. Visually analyzing large (digital) image collections. In: VisQual Methodbox, URL: https://visqual.leibniz-ifl-projekte.de/methodbox/2024/01/29/sketching-and-mapping-rendering/
Essentials
- Aim: Sketching and mapping of (digital) images is a qualitative approach to the analysis of large image databases. It is especially suited to investigate the (purposeful) construction of imaginary spaces in (digital) planning visualizations.
- Context: The approach is based on Visual Discourse Analysis and architectural methods of sketching and mapping. It can be combined with a diverse set of other methods to research specific urban questions (e.g., visualizations in planning processes, and the communication between different actors).
- Approach: To analyze large collections of (digital) images, a combination of methods is necessary.
Description
Sketching and mapping aims at investigating large amounts of digital images. This approach has been developed for the study of renderings as a form of architectural visualization, and asks how renderings are used to create imaginary spaces, and thereby to legitimize urban development projects. It seems possible to employ the sketching and mapping method for other research questions about urban developments or related fields.
Most existing visual methods are concerned with the analysis of single images. Only some authors describe qualitative approaches to small sets of images (e.g., in social science and visual discourse analysis: see Rose 2016; Fegter 2011) or image “clusters” (Müller 2016). Additionally, quantitative and computer-aided approaches exist to analyze large image collections (e.g., in digital art history, or Rose and Willis 2019). By building on these approaches and combining them with architectural methods of sketching and mapping, a large number of digital images can be analyzed. In this example, renderings are analyzed as a specific type of architectural visualization. The method presents a newly developed interdisciplinary approach that – as of 2023 – awaits further experimentation.
The outcome is a visualization (a “mapping”) that doesn’t render an objective representation of the imaginary spaces created in (digital) images, but that is considered a research tool to visually interpret these spaces. It thereby helps to answer questions about the use and purpose of (digital) visualizations that are published, for example in the context of planning processes.
The main challenge of this method is the availability of digital data for specific urban research questions, as this data may be limited or difficult to obtain. In the process of analysis, the positionality of the researcher must be countered by reflecting on the sketching and mapping process. This is possible in interdisciplinary data sessions, for example. The visual results (“mappings”) have to be interpreted accordingly. The method is limited by the use of line drawings to a certain extent. These (architectural) drawings tend to focus on built structures, leaving aside other, non-architectural elements in the images. Due to these limitations, the sketching and mapping method must be combined with research on the context of the image-worlds, for example the planning processes that they’re part of.
Procedure and Example
Step 1: Building an Image Database
A digital image database is built according to the specific research question. For example, all renderings that have been published for a planned building, urban space, or neighborhood, are collected. In some cases, online data can be pulled from platforms like Twitter or YouTube that benefit from a standardized data structure (Rose 2016, pp. 288–306) and allow for automated collection (“scraping”) of images which requires programming skills, depending on the data source. However, for studies on the image-worlds of specific urban development projects, renderings appear in different online formats and must be collected manually.
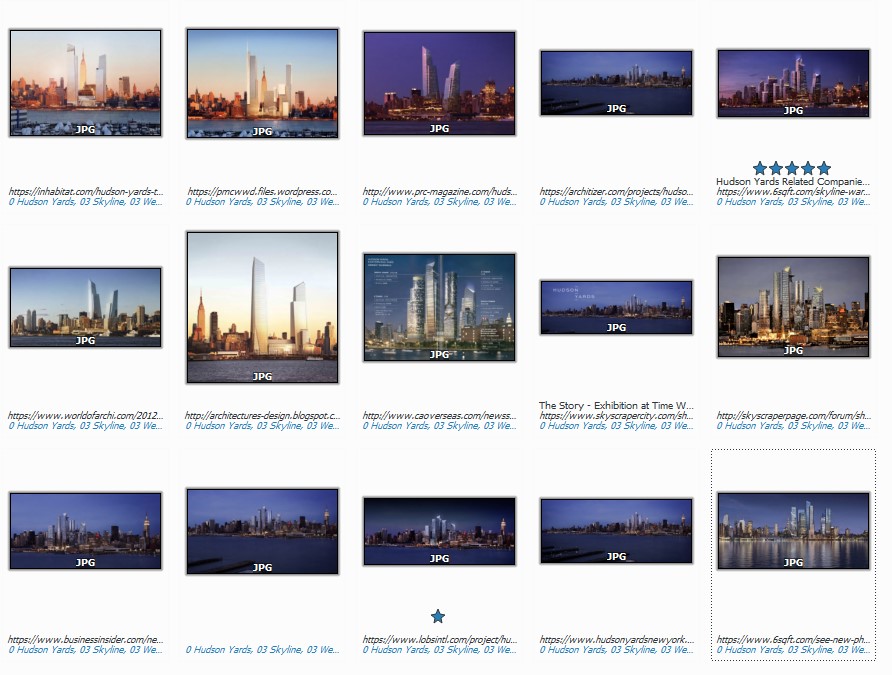
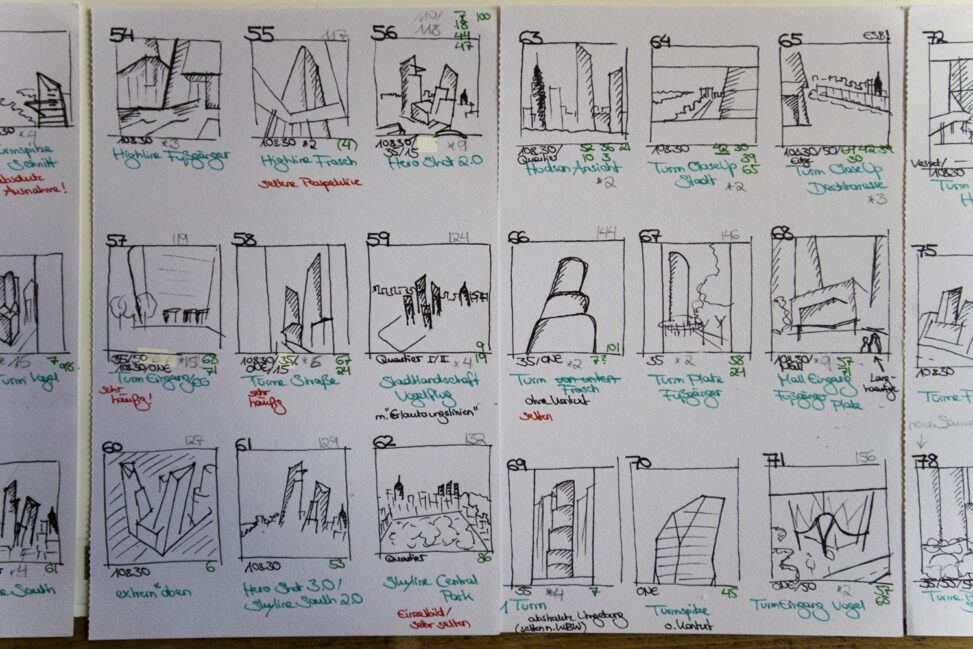
Image 1: Screenshot of an image database with renderings of two urban development projects (Mélix 2022, p. 115)
It is useful to follow a “snowball” principle, starting with the most obvious sources (e.g., developer’s websites) and then use reverse image search functions to complete the collection, if necessary. In image management software, metadata is edited to sort the collection (e.g., use tags to assign publication dates, locations, visualizers, or other project information).
Step 2: sketching analysis

Image 2: Example of analytical sketches for the analysis of a rendering collection (Mélix in press)
Make quick, rough hand sketches to abstractly depict the composition and content of the images while going back and forth in the image collection. This process is used to gain an overview over the image collection, to identify different phases in the image production, and to discover potentially recurring image types as patterns of representation.
The sketching process, as a process of abstraction and structured way of looking, helps to create a distance from personal and professional assumptions. For the case of digital visualizations as part of planning processes, I suggest proceeding chronologically in the first step. Later, the resulting sketches can be cut out and regrouped based on different criteria (e.g., to assemble similar image types, compositions, or other criteria, based on the specific research question). This can be done digitally after scanning the hand-drawn sketches.
Step 3: mapping of image types
In the last step, a visual interpretation of the sketches is drawn. All sketches are grouped and mapped into an arrangement. This can be done in illustration or layout software, but also by hand drawing. I call this process “mapping”; it can show all the image types used throughout the image collection (see example shown below). It thereby provides a visualization of the imaginary space created in the renderings.
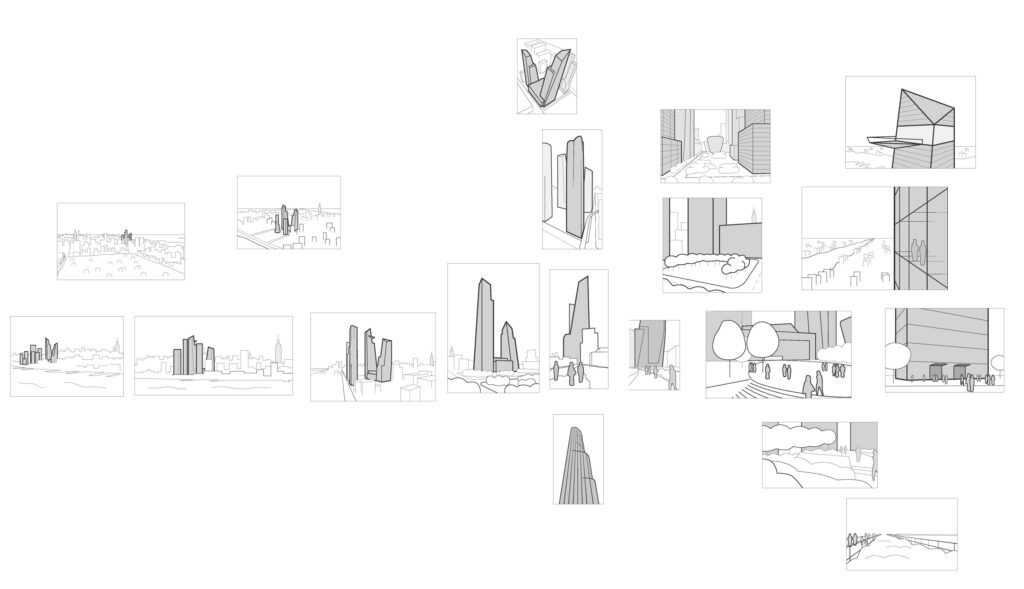
Image 3: Mapping of Image Types for renderings of the urban development project “Hudson Yards” in New York (Mélix and Christmann 2022, p. 306)
Mapping as a research tool shows the image types that are used to construct imaginary (or planned) spaces (see image 3). It can be used to explain how these are used to communicate and convince viewers. Examples for image types in the image above are the “Hero Shot” (one building is visualized as an outstanding icon without much urban context), or the “Skyline” (a planned development is shown as part of a waterfront or urban skyline with other high-rise buildings).
This mapping can be combined with other research methods that provide additional, contextual information about the images. For example, information about actors, locations and dates helps to investigate the role of images and their relation to the respective planning processes. Expert interviews can help to explain how, when, and why specific images are produced and published. The analysis of specific images can further explain how the image-worlds are created on the level of individual images.
Later use of the resulting sketches and mappings (e.g., in planning processes and participation) seems possible.
Requirements
- Basic skills in sketching by hand
- Some skills in digital image management
- Skills in visualization or layout software for drawing, sorting, and mapping is helpful.
Evaluation
The method was applied for renderings of urban development projects so far. I suggest that it can easily be adapted to other forms of architectural and planning visualizations. It remains to see if research on other digital image collections finds the method useful.
Research on renderings (and all urban phenomena) always deals with complex, discursive processes, of which digital images are only one part. Any visual analysis and interpretation of digital images in planning processes must (to a certain extent) also account for the context of their production and dissemination. Therefore, a combination of methods must be developed in accordance with specific research questions.
In my example, the visual analysis has been combined with an analysis of the planning processes (planning timelines), expert interviews with visualizers, and single-image analysis (see Mélix and Singh 2021; Mélix in press)
The image collection must be done according to the research question and might take long in comparison to the analysis of single or small series of images. A concentrated and thorough phase of visual analysis is needed, but there are not many other limitations or costs. There are good opensource software solutions for all the steps described above (see: suggested tools).
Suggested Tools
- Photo Management software (e.g., Open Source: DigiKam)
- Sketchbook and colored pens
- Scanner
- Digital visualization and/or layout software, according to personal preferences
References
Visual (Discourse) Analysis
Breckner, Roswitha (2008): Bildwelten–Soziale Welten. Zur Interpretation von Bildern und Fotografien. Online-Beitrag zu ‚Workshop & Workshow Visuelle Soziologie‘: Edited by Universität Wien.
Fegter, Susann (2011): Die Macht der Bilder. Photographien und Diskursanalyse. In Gertrud Oelerich, Hans-Uwe Otto (Eds.): Empirische Forschung und Soziale Arbeit. Ein Studienbuch. 1. Aufl. Wiesbaden: VS Verlag für Sozialwissenschaften, pp. 207–219.
Keller, Reiner (2016): Die komplexe Diskursivität der Visualisierungen. In Saša Bosančić, Reiner Keller (Eds.): Perspektiven wissenssoziologischer Diskursforschung. Wiesbaden: Springer Fachmedien (Theorie und Praxis der Diskursforschung), pp. 75–93.
Müller, Michael R. (2016): Bildcluster. Zur Hermeneutik einer veränderten sozialen Gebrauchsweise der Fotografie. In Sozialer Sinn 17 (1), pp. 95–141. https://doi.org/10.1515/sosi-2016-0004
Raab, Jürgen (2012): Visuelle Wissenssoziologie der Fotografie. In Österreichische Zeitschrift für Soziologie 37 (2), pp. 121–142. https://link.springer.com/article/10.1007/s11614-012-0025-7
Rose, Gillian (2016): Visual methodologies. An introduction to researching with visual materials. 4th ed. London: SAGE.
Rose, Gillian; Willis, Alistair (2019): Seeing the smart city on Twitter. Colour and the affective territories of becoming smart. In Environment and Planning D: Society and Space 37 (3), pp. 411–427. https://doi.org/10.1177/0263775818771080
Sketching and Mapping Method: Research on renderings
Mélix, Sophie (in press): Speculative Renderings. Atmospheres of Urban Development Projects in Lagos and New York. Cumulative Dissertation. Technische Universität Berlin, Berlin.
Mélix, Sophie (2022): Renderings. Bildwelten zur Legitimation von spekulativen Stadtentwicklungsprojekten in Lagos und New York. In sub\urban. zeitschrift für kritische stadtforschung 10 (1), pp. 97–126. https://doi.org/10.36900/suburban.v10i1.595
Mélix, Sophie; Christmann, Gabriela (2022): Rendering Affective Atmospheres. The Visual Construction of Spatial Knowledge About Urban Development Projects. In Urban Planning 7 (3), pp. 299–310. https://doi.org/10.17645/up.v7i3.5287
Mélix, Sophie; Singh, Ajit (2021): Die visuelle Refiguration urbaner Zukünfte. Zur Prozessualität von digitalen Architekturvisualisierungen am Beispiel von Hudson Yards in New York. In Martina Löw, Volkan Sayman, Jona Schwerer, Hannah Wolf (Eds.): Am Ende der Globalisierung. Über die Refiguration von Räumen: transcript (Re-Figuration von Räumen), pp. 231–256.
Mapping as a Method
Baxter, Jamie Scott; Marguin, Séverine; Mélix, Sophie; Schinagl, Martin; Singh, Ajit; Sommer, Vivien (2021): Hybrid Mapping Methodology. A manifesto. Edited by TU Berlin. Berlin (SFB 1265 Working Paper, 9). Available online at https://sfb1265.de/publikationen/working-paper/
Marguin, Séverine; Pelger, Dagmar; Stollmann, Jörg (2021): Mappings als Joint Spatial Display. In Anna Juliane Heinrich, Séverine Marguin, Angela Million (Eds.): Handbuch qualitative und visuelle Methoden der Raumforschung. Bielefeld: transcript (UTB, 5582), pp. 381–399.
Leave a Reply