
Unlocking the Potential of Story Maps as a Novel Visualization Tool in Transformative (University) Teaching
Author:
Sarah Klosterkamp
Citation:
Klosterkamp, S. (2024): Story Maps. Unlocking the Potential of Story Maps as a Novel Visualization Tool in Transformative (University) Teaching. In: VisQual Methodbox,
URL: https://visqual.leibniz-ifl-projekte.de/methodbox/2023/09/29/story-mapping/
Essentials
- Usefulness: Story maps present the opportunity to address intricate topics with significant social relevance through visually engaging and well-structured maps. Story mapping can be used as a versatile tool in geographic teaching-learning contexts for individual use or collaborative group work.
- Transformativity: Story maps unfold their transformative potential on the one hand through their feminist way of working and producing and on the other through the special interplay of (im)materiality, grounded data sets, and cartographies.
- Applicability: A multitude of digital offerings and platforms are suitable for the technical implementation of story mapping in the context of (university) teaching. This entry suggests using story maps as an alternate approach to geographic work. It represents one of the many ways through which narrative formats can be integrated into educational settings, be it universities or schools. It also facilitates geographical concepts to be conveyed in a visually appealing and accessible way for a broad audience.
Description
A reflective approach to maps and their design is now part of the fixed canon of transformative educational endeavors. It has generated a variety of important impulses for the use of maps as well as for their collaborative elaboration and interpretation with learners (e.g., Glasze 2009; Kollektiv orangotango+ 2018). This transformation has resulted in a shift towards heterodox, creative, and even artistic approaches and concepts in the creation and discussion of, with, and about cartographic modes of representation both within and outside of geography in recent years.
The Anglo-American scientific community, in particular, has been embracing a more open approach to geographic knowledge production for several years. This has led to a deeper engagement with alternative map models, mapping forms, and narratives (such as Open Street Map, Relief Maps, Vignettes etc.), as well as visual modes of collecting and presenting geographic research results (e.g. Crang 2020; Pink 2007). This opening is also reflected in very different modes of preparation and recognition of more experiential bodies of knowledge and their subject-centered participatory to collaborative modes of production (e.g., Garrett 2011; Hawkins 2019; Katz 2013; McKittrick 2021; Noxolo 2018; Velasco et al. 2020).
In recent years, the works of such scholars have very powerfully demonstrated how map productions, in particular, can give more space to a feminist, decolonial, and/or anti-hegemonic perspective apart from pure textual and map representations, thus significantly enriching the field of geographical thematic and working practices. In addition to older and rediscovered formats such as the comic book (e.g., Dittmer 2012; Case 2021; Katz 2013), this arena has also been witnessing approaches of an alternative, digital mapping and visualization of human geographical concepts and new forms of knowledge processing with transformative potential. These new approaches are evident, for example, in the form of auto-ethnographic photostories (e.g., Case 2020), within participatory, emotionally-affective methodologies, or with and through approaches from the field of Feminist GIS (Geographic Information System) (e.g., Whitesell & Faria 2019).
Concurrently, issues related to mediation and collaborative elaboration of geographical knowledge have also become a central concern of transformative educational efforts in recent years (Schreiber & Carstensen-Egwuom 2021). These issues extend to notions of ‘Politics of Fieldwork’, research ethics and the care of/with/for research participants, which are in most cases especially burdensome and troubling to young academics in schools and universities (e.g., Vorbrugg et al. 2021).
This entry ties in both strands of debate and shifts in discipline, as story mapping combines classic mapping techniques with new, digital forms of storytelling and visualization (refer to the “Example(s)” section and Images 1-5). The interweaving of geographical working methods on the one hand and different digital media such as infographics, text modules, and diagrams on the other hand, thus enables interactive exploration of geographically relevant topics on different user interfaces. Drawing from personal experience gained in university courses, the following section will introduce two central elements of working with story mapping tools. I will also delve into the hurdles and obstacles in co-creating story maps with learners. In the final section, I will conclude by summarizing the transformative potential that working with story maps offers to the field of geography in general and, more specifically, to geographic teaching and learning contexts.
Procedure
The core element of a successful story map lies in its narrative. Good storytellers acknowledge that the first step in crafting a meaningful story is not to jump into the work but to take time to prepare and outline their original ideas. Therefore, it is advisable to work with learners right at the beginning to address basic questions: For whom should the story be written, what should the readers learn, and how can we most effectively connect with them? Experience shows that these first steps often pose the biggest hurdle for the learners. Collaboratively working out and mastering these basics is the most crucial “tool” for practical research and content and visual preparation, eventually shaping your story maps. Being best prepared means being able to act and design as independently as possible in the sense of a feminist-inspired teaching and learning philosophy (Klosterkamp 2023: 355f.; see also: Schreiber & Carstensen-Egwuom 2021).
Step 1: Identify the target audience
- For whom should the story be written?
- What do you want the reader to learn?
- What is the most effective way to connect with them?
Step 2: Define the most important aspects
- What content should be conveyed to the target audience?
- Which aspects are particularly important?
- What are the “key questions” that require collaborative development?
Step 3: Create a content inventory
- What materials (maps, images, infographics, interviews, etc.) are already available?
- What materials are still required?
- Who still needs to be approached, and which places need to be visited for the pending materials?
- Who can provide support?
Step 4: Drafting an outline
- In what order should the content identified as important from Step 2 be presented to the target audience identified in Step 1?
- Which materials identified from Step 3 best fit within each level of the outline and the content to be presented there?
Step 5: Technical and visual implementation with ArcGIS
- How and with which tools should the practical implementation and creation of the story map be done?
- Which materials can be animated and/or digitized in a more appealing way?
- Are there any points at which technical adjustments may be necessary?
Requirements
- Everyone interested in creative mapping and visualization techniques
- Timeframe: 2–4 weeks
- For beginners, the use of ArcGIS is recommended. Additionally, there is a bench of free providers and templates (refer to the section “Useful Resources and More Story Maps” below)
Evaluation
- Contexts: Teaching, Public Outreach
- Efforts: 2–4 weeks
- Costs: None; all software and tools suggested are open-source/freeware
Example
Images 1-5 (created by the students Alen Veličanin, Georg Yahraes, Lars Zlotnik, Leif Opdenacker) illustrate what a story map can look like at the end of a methodological work of beginners’ story mapping. The story map was developed during a methods seminar with bachelor students of the University of Bonn. In the context of self-selected, topic-related projects related to their everyday experiential geographies in Bonn’s city center, four different collaborative story maps were designed, one of which is examined in more detail here.
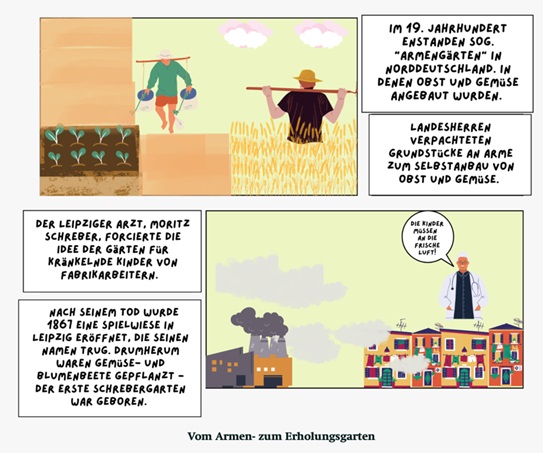
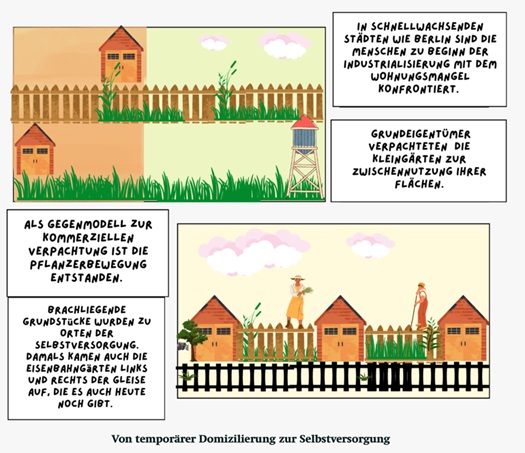
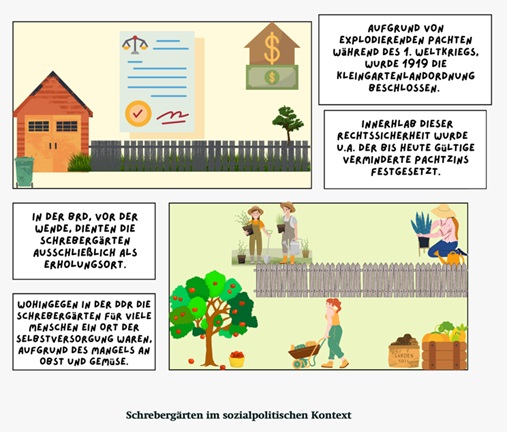
In this story map, a student research project explored the question of what consequences the current housing crisis imposes on the housing conditions of elderly people and what alternative forms of housing can be found in allotment gardens. For this purpose, the history of the German allotment garden movement was reproduced utilizing comics (cross-reference), and the story map was enriched with original mappings, ethnographic explorations, and photographs.
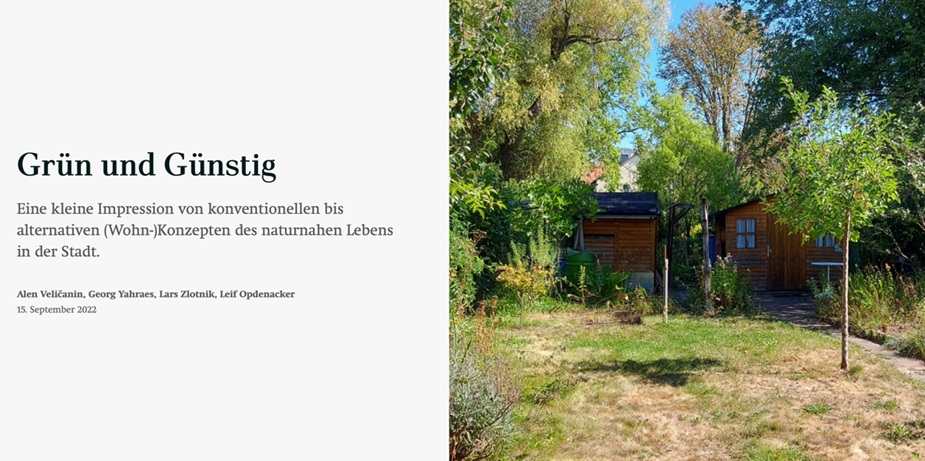
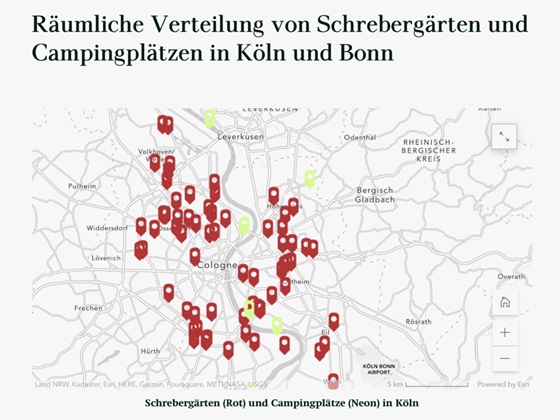
Images 1–5: StoryMap “Grün und Günstig”, by Alen Veličanin, Georg Yahraes, Lars Zlotnik, Leif Opdenacker. online accessible: https://storymaps.arcgis.com/stories/3ef3d168cccf4c55b8f6c247220158da
As demonstrated by the example, story mapping offers a wide range of potential(s). As an alternative method to geographic work and a new, digital way of communicating geographic content, story mapping offers a lot of potential. It can be used as a medium and method in university and school teaching to develop and implement new narrative formats that also enable geographic topics and transformative knowledge productions to be prepared in the form of animated, digital “learning paths.”
Story maps are highly intuitive and interactive. The low-barrier, visual – and, if desired, multimedia – form of story maps offer the opportunity to present even more complex scientific topics and analyses in a way that can be made available in a low-threshold as well as cost-free manner (e.g., by embedding them in existing web presences or else sharing them on other channels in the form of web links).
The experience of self-efficacy and the feeling of being able to create meaningful content in a school or academic setting is what extends interest beyond the immediate setting, pointing to the particular transformative potential of working with story maps. It seems worthwhile to me to make this work fruitful elsewhere (e.g., for theory-practice transfer).
Useful Ressources
- „Femi(ni)cide – Patriachale Gewalt sichtbar machen“, AK Feministische Geographie Frankfurt (2021), https://storymaps.arcgis.com/stories/d5f0ca7d7436478a8883a00993b183e2
- www.lernlabor-visualstorymaps.info
- Klosterkamp, Sarah (2023). “StoryMapping”. In: Handbuch Transformative Geographische Bildung, edited by Verena Schreiber and Eva Noethen, Wiesbaden: Springer, 351-356. https://www.springerprofessional.de/transformative-geographische-bildung/25983202?tocPage=1
Suggested Tools
- ArcGIS | vector-based, cartography-oriented platform for the creation and generation of story maps (online at: https://storymaps.arcgis.com)
- Infogram | for the creation of animated graphics and diagrams (online at: https://infogram.com)
- Canvas | for the creation of digital comic strips (online at: https://www.canva.com)
- Esri Maps | thematic maps and demographic datasets to extend your own story mapping projects (online at: https://livingatlas.arcgis.com/policy/overview)
References
Crang, M. (2020): Visual Methods and Methodologies. In: DeLyser, D. et al. (Eds.), The Sage Handbook of Qualitative Geography, 208–224. https://doi.org/10.4135/9780857021090
Dittmer, J. (2012): Captain America and the Nationalist Superhero: Metaphors, Narratives, and Geopolitics. Philadelphia: Temple University Press. https://tupress.temple.edu/books/captain-america-and-the-nationalist-superhero
Fall, J.J. (2021): Worlds of Vision: Thinking Geographically Through Comics. ACME An International Journal for Critical Geographies 20(1): 17–33. https://acme-journal.org/index.php/acme/article/view/2037
Fall, J.J. (2020): Fenced In. In: Environment and Planning C: Politics and Space 38(5), 771–794. https://doi.org/10.1177/2399654420933900
Garrett, B.L. (2011): Videographic geographies: Using digital video for geographic research. In: Progress in Human Geography 35(4), 521–541. https://doi.org/10.1177/0309132510388337
Glasze, G. (2009): Kritische Kartographie. In: Geographische Zeitschrift 97(4), 181–191. https://www.jstor.org/stable/23031916
Hawkins, H. (2019): Geography’s creative (re)turn: Toward a critical framework. In: Progress in Human Geography 43(6), 963–984. https://doi.org/10.1177/0309132518804341
Katz, C. (2013): Playing with fieldwork. In: Social & Cultural Geography 14(7), 762–772. https://doi.org/10.1080/14649365.2013.839823
Leave a Reply