

… or Practicing Cultural Cartography
Author:
Lukinbeal, Chris
Citation:
Lukinbeal, C. (2024): Google Mapping and Web Publishing Made Easy or Practicing Cultural Cartography. https://visqual.leibniz-ifl-projekte.de/methodbox/2024/08/20/google-mapping-and-web-publishing-made-easy/
Essentials
- Democratization: This essay and website promote the democratization of cartography by offering a guide to free Google mapping and web publishing resources.
- Tools: This guide presents applications, skills, and tips and tricks to speed up workflow, do quality cartography, and match that quality with well-designed web pages.
- Literacy: This guide seeks to promote the teaching of geographic media literacy skills across online platforms known by students.
Description
From the neo-geographers of the geoweb to the human geographers who seek to map their research findings without a GIS background, making maps should not be difficult or aloof from daily practices to any geographer, social scientist, or humanities researcher. Neo-geographers, or new geographers, are those that use web-based geographic information system tools and location-based services, or the geoweb, to create maps and explore new social-spatial interactions.
But how can we as human and cultural geographers become cultural cartographers overnight? The guide to free Google mapping and web publishing presented here offers a series of tools to help anyone become a web mapping cultural cartographer. As Mark Twain in 1866 once wrote,
“the only real, independent & genuine gentlemen in the world go quietly up and down the Mississippi River, asking no homage of anyone seeking no popularity no notoriety and not carrying a damn whether school keeps or not.”
I use this quote as it references the meandering base map shown on the Google Mapping and Web Publishing Made Easy homepage (Lukinbeal 2024; hereafter, Google Mapping Guide). Mark Twain’s quote reminds us that to know a place and to map a place are two different things: there’s the grid and there’s the ground (Mark Twain was a riverboat captain on the Mississippi River). Cartography should not be a skill, technique, school of thought, or philosophy that is held out of the reach of ordinary citizens. The neo-geographer’s movement in the early 2000s sought to spread the use of open-source and free online applications to do critical mappings (Leszcznski 2014). Some cartographers referred to this as the democratization of cartography (Byrne and Pickard 2016) as the use of web applications made making maps and location-based services easier to use.
Making maps and using geographic technologies and the geoweb are a part of basic geographic literacy and especially geographic media literacy. Geographic media literacy combines four different literacies: visual literacy, media literacy, information literacy, and information technology literacy (Lukinbeal 2014). Visual literacy focuses on being able to interpret and discriminate amongst visible objects, symbols, and actions to master visual communication and evaluate visual culture (Fransecky and Debes 1972). Similarly, media literacy focuses on skills that allow users to evaluate and interpret media including maps. Information literacy includes “recognizing when information is needed, having the ability to locate, evaluate, and effectively use information, an understanding of the economic and social issues of information use, and knowing how to access and use information ethically and legally” (Lukinbeal 2014, 43). While students work on literacies whilst using the Google Mapping Guide, the main focus is on information technology literacy. Information technology literacy focuses on three skill sets: “(1) contemporary skills, focusing on the application of current knowledge; (2) foundational concepts, comprising the principles of technology; and (3) intellectual capabilities, the ability to apply skills and concepts to solve problems” (Lukinbeal 2014, 42).
The Google Mapping Guide is part of this democratization by providing activities that lead to the skills needed to produce web-based mapping and publishing. Though democratization may be a part of this movement, it is hard to fully see it as such unless you are using and learning open-source software and data. Google applications, while useful and free, should not fully be considered democratizing because you are essentially supporting a transnational corporation. Having said that there are still benefits of using Google for mapping and web publishing. Three of the main critical considerations before doing so are (1) to determine how much data privacy should be considered before using these tools (discussed later) and (2) do you want to use and promote a company that the US Justice Department declared a monopoly and is considering it for an antitrust break-up (Nylen and Edgerton 2024). Finally, a third consideration to using the Google Mapping Guide is that it allows teaching students geographic media literacy skills, mainly information technology literacy, using online free applications that students have some familiarity with. This familiarity is an advantage because they are easy to use, can be taught on almost any computer with a decent internet connection, and can help focus students on the creative process of web publishing and mapping rather than on learning complex, expensive, and proprietary GIS-based systems.
In this guide, I present applications, skills, and tips and tricks to speed up workflow, do quality cartography, and match that quality with well-designed web pages.
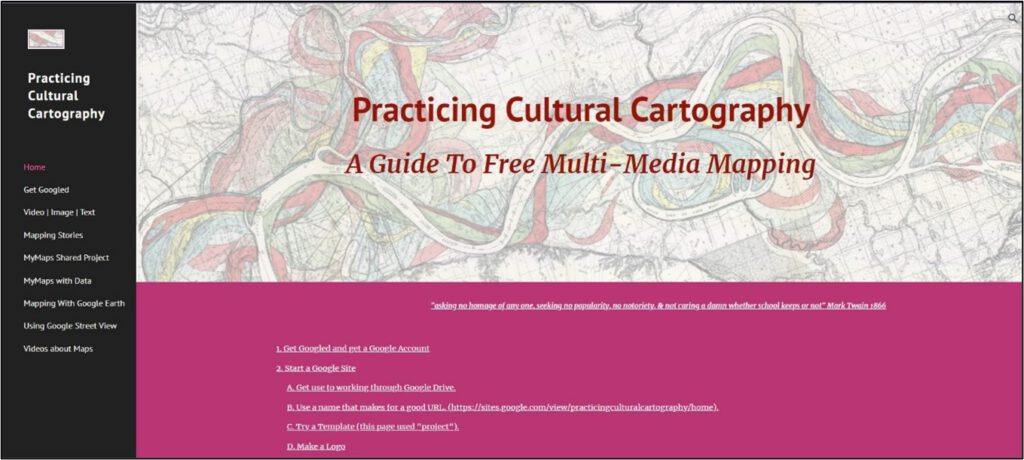
Figure 1: Practicing Cultural Cartography Homepage (Lukinbeal 2024)
Consider Copyright Issues
If you click on the Mark Twain quote on the Google Mapping Guide it takes you to The United States Library of Congress and maps of the meandering Mississippi River. Consideration of how to obtain and use copyright-free images is important. With older maps like with most media, the copyright expires after a hundred years in the US. As the US Copyright Office states:
“Generally, for most works created after 1978, protection lasts for the life of the author plus 70 years. For anonymous works, pseudonymous works, or works made for hire, the copyright term is 95 years from the year of first publication or 120 years from creation, whichever comes first” (US Copyright 2024, 1).
At the bottom of the “Get Googled” page, I offer two library resource guides on how to use and cite Google map products in publications. Understanding when and how you can use and cite media from other sources on the web is an essential information literacy skill.
Get Googled
The Google Mapping Guide can be broken into sections. Perhaps the most important section is the “Get Googled” page. This is where I provide links and video clips – long and short – on how to use the Google applications for mapping and publishing. Where Google Sites focuses on web making and publishing, Google Drive is for Cloud Storage and is used as a container for all your web and map documents. Google MyMaps and Google Earth Pro are the two free web mapping applications. With Google MyMaps you can make maps using data or create a shared map where multiple people contribute to the same map using their own Google accounts. Google MyMaps is based on the extremely popular Google Maps which is predominately used to help users navigate from one place to another. Google Earth Pro is an excellent mapping application for creating 3d-looking maps and flythroughs, however, it does not integrate well with Google Sites. Because of this, I demonstrate how to make 3d still maps using Google Earth Pro and PowerPoint. YouTube Studios is a repository for videos you make or collect from other YouTube sites for use on your Google Sites page. Google has an entire suite of Office applications that also can be used in web publishing and integrate well with Google Sites and Google Drive. The most common Office applications include Google Docs, Sheets, Slides, Photos, and Forms. Google Street View offers panoramic views along streets and includes user-contributed interiors and walkways. Google Street View does not integrate well with Google Sites and those issues are discussed in the guide. Google Analytics can be used in conjunction with Google Sites to provide you with statistics on how frequently your website is being used.
The “Video | Image |Text” section focuses on frequently needed web publishing and editing tools like video editing, image capture and conversion, text character maps, and screen grab software. Free resources are provided for both Microsoft and Apple computer users. Web publishing and mapping needs to have a narrative and one of the simplest ways of doing that digitally is to get into video editing and recording because with so many new video-editing software out there, we can now become media producers rather than just teachers and researchers.
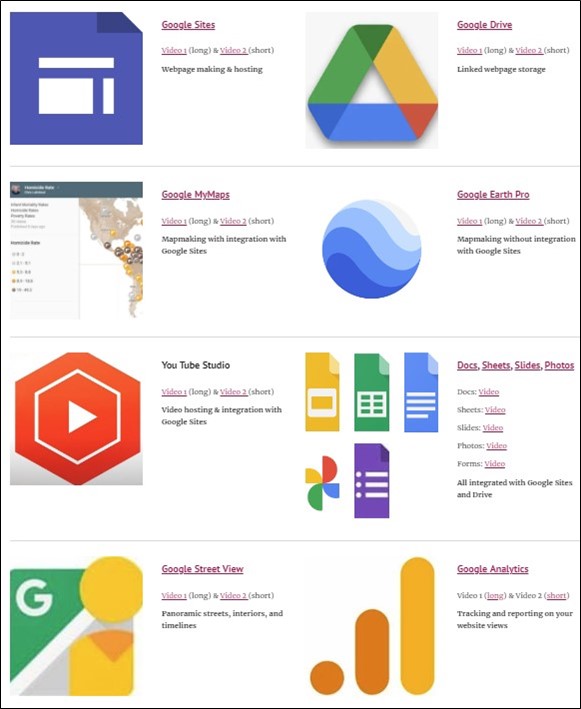
Figure 2: Get Googled (all images by author)
Mapping Stories
The next section “Mapping Stories” provides ESRI resources for how to do good storytelling for StoryMaps. StoryMaps is an application that is part of ESRI’s ArcGIS Online application collection. However, not every university or user can afford an ESRI license. The tools offered in this Guide – between using Google Sites and other Google applications – offers an alternative to using StoryMaps. Both Google Sites and StoryMaps now operate using “content blocks” where you select preset templates to make different blocks of content on your StoryMaps or Google Site. The main difference is that where StoryMaps offers more high-end multi-media content block choices, StoryMaps requires a website to publish its final product to like a Google Site. In contrast, Google Sites offers both content creation and web publishing. The Mapping Stories section offers advice on how to best narrate your map. One example shown on the website of narrative mapping is Lukinbeal’s (2018; Lukinbeal and Sharp 2019) research on how to use a common Hollywood Blockbuster narrative formula to create a Google Earth Pro-based geovisualizations. These Google Earth Pro flythroughs were made using free video editing software along with html programming to make custom popups windows shown in the flythroughs.
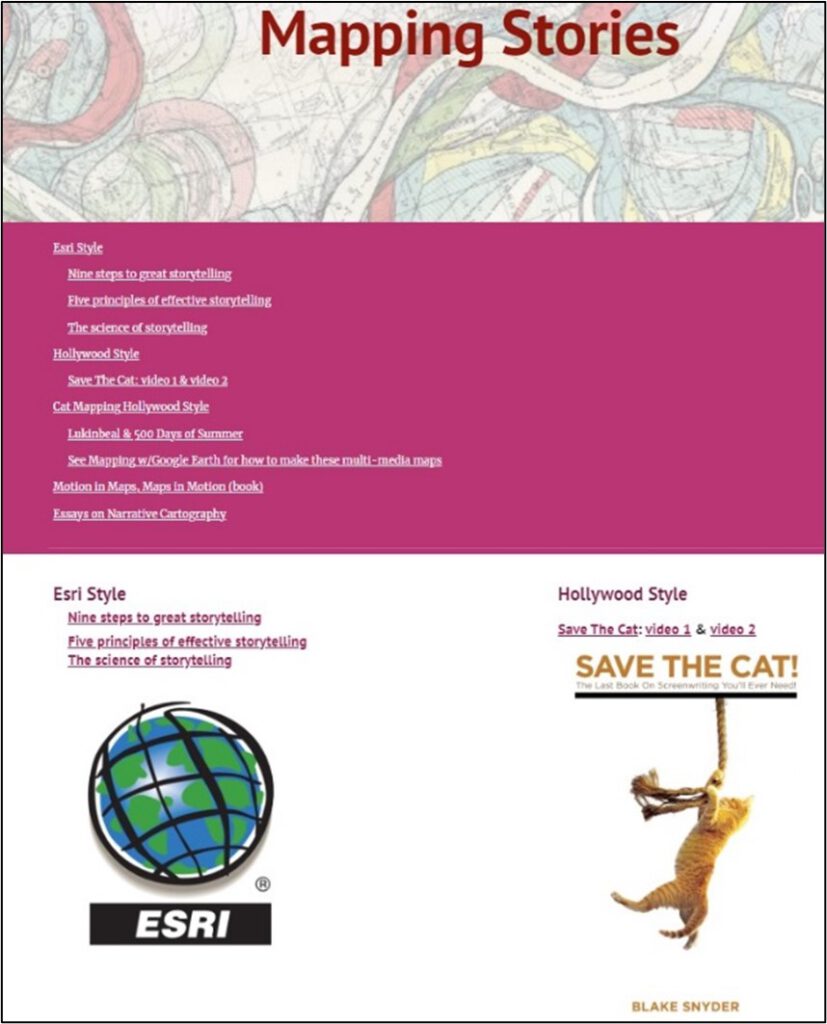
Figure 3: Mapping Stories (all images by author)
Using Google MyMaps
Google MyMaps can be used for shared mapping projects and “MyMaps with data”. MyMaps allows for multiple users to contribute to a single map if the sharing properties are set correctly in Google Drive. Shared maps are an excellent way to do team projects where you have multiple people contributing to the same map. MyMaps can also be used as a rudimentary geographic information system where you can import or create data, symbolize it, and publish it online. As an example, the MyMaps with Data section of the guide uses data from the Organization for Economic Cooperation and Development and DESTATIS to map European migration in 2021 by country and foreign populations in 2022 by federal states in Germany. Google Earth Pro spatial data files are called KML or KMZ. These files can also be imported and used however MyMaps has a 10-layer limit which can make it impossible to make a choropleth map of Germany by federal states (since Germany has 16 federal states). A choropleth map displays numerical data by area with regions given colors to reflect different data values. Furthermore, there is a data limit of 5 MB per layer in MyMaps making the use of KML or KMZ limited because of the data size limitation. This often means that a KML or KMZ file you might want to use in your map may have too large of a file size to be usable.
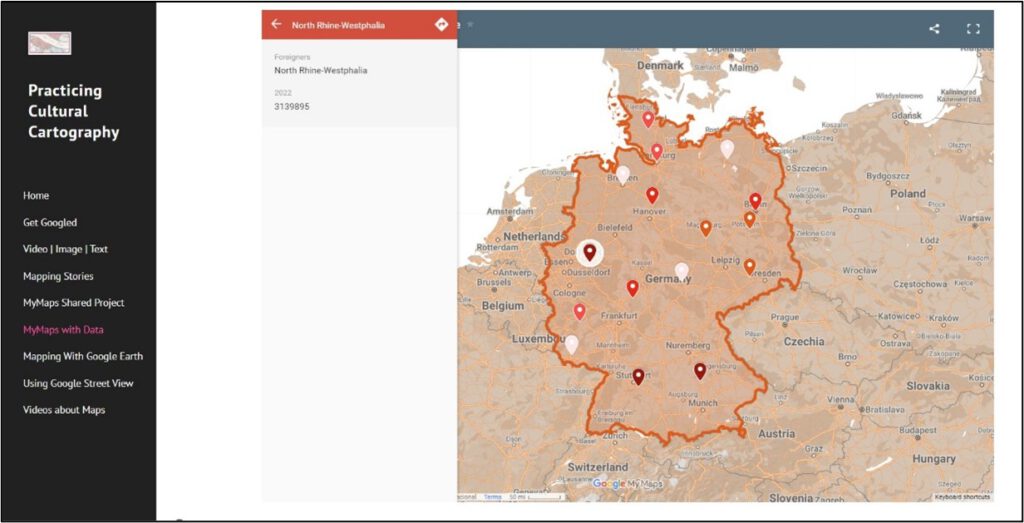
Figure 4: MyMaps with Data section (all images by author)
Mapping With Google Earth Pro
Google Earth Pro is a separate software package from Google Maps and Google MyMaps that can produce various outputs suitable for geovisualizations. With Google Earth Pro, you can make amazing 3d static maps, flythroughs where you move from one point on your map to another, and even show historic maps in their correct position overlaid on current Google Earth Pro imagery (each of which is presented in the Mapping with Google Earth Pro section). You can also make Tours with Google Earth Pro which takes you on narrated tours of spatial items from around the world. However, one of the main drawbacks of Google Earth Tours is that they cannot be directly embedded into a Google Site. I offer two simple solutions for integrating Google Earth Pro into your website. The first is to make a Google Earth tour or flythrough and tape them with free video editing software, for instance, ClipChamp or iMovie which are listed in the Video | Image |Text section. Alternatively, you can take advantage of the aerial views of Google Earth Pro and use them as base maps and draw on top of them. In the Google Mapping Guide I demonstrate how to create a 3d static map of Mainz, Germany shown in figure 5 and discussed on this YouTube video.
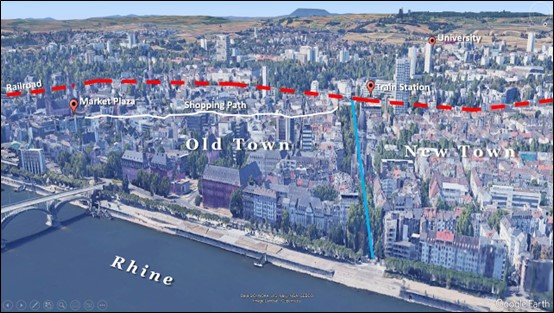
Figure 5: Google Earth Pro Map of Mainz, Germany (Google Earth image modified by author)
Using Google Street View
Google Street View has been in operation since 2007 and is integrated in Google Maps. It provides the option to see change over time, as illustrated in the Google Mapping Guide (see figure 6 below). Google Street View has three different modalities: #1 Street View classic where you see what the car sees as it is driving down the street; #2 photospheres created by individuals at sites anywhere in the city and uploaded and shared to Google Street View; #3 photosphere routes were an individual has walked down a specific route and collected 3-dimensional imagery and shared it on the Google Street views platform. Google Street View is a separate application and like Google Earth Pro it has issues integrating with Google Sites. Mainly, you cannot put a URL from a Street View image directly into Google Sites. Because of this, I provide ways to work around this issue.
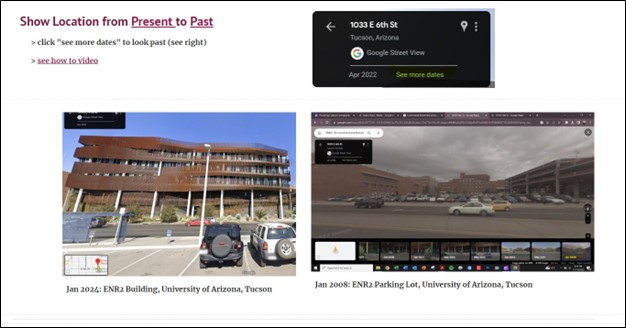
Figure 6: Google Street View, Then and Now (Google Street View, images by author)
Videos about Mapping
In the Google Mapping Guide, I have provided an online museum of videos about mapping. There are a couple of historical ones, a series about the history of longitude with actor Jeremy Irons, and two maps about Johnny Cash’s “I’ve Been Everywhere Man”. The first map shows all the locations from the song while the second map is an Esri video spoofing the song with the video, “I’ve Coded Everywhere Man.” There is also one by Lukinbeal on the importance of the US Township and Range Grid and its role in the US and Arizona. Beyond that, there is just a collection of cool 1930s through 1970s documentary-style videos showing how mapmaking was done in those eras. I am particularly fond of the TV mini-series, Longitude (2000), which is fully available on YouTube. The mini-series charts two stories: one about John Harrison who in the 18th century built a marine chronometer that allowed for accurate readings of longitude at sea and two a story about Rupert Gould who in the 20th century sought to locate and restore Harrison’s clock.
Discussion
The Google Mapping Guide is meant to be a workshop (3 hours) or a multi-day classroom exercise. It offers step-by-step instructions on how to make a digital copy of maps and webpages from the Google Mapping Guide. Let’s take a quick look at the step-by-step instructions from the homepage and see how the workflow goes.
First, get a Google account and start by using Google Drive through a web browser as your primary location of work. Second, start a Google Site by using Google Drive and creating a “new” Site. Two important terms in web creation are the logo and the favicon. I recommend that these be the same image. What they do is they provide a visual icon for your website so using it reinforces your page’s imageability. Next comes planning for your website: how many pages should it be? What color schemes do you use? Typically, when you make a webpage, you have an idea of what you want to accomplish but you’re not sure how many pages it’s going to be. Building out your website becomes an iterative process where you begin on one page and keep the elements that are central to a theme on that page. Once that theme has run its course you move on to another section and a new page or section on your website. Sometimes a section needs to be broken in two if it becomes too long. There is a general rule that each page should be only as long as an inattentive web user can pay attention, so I suggest no more than five to seven thematic content blocks.
After deciding how the website will be laid out, shifting to making maps and doing the MyMaps Shared Project activity first is the best and simplest place to start. In that exercise, you will also learn how to deal with layering, coloring, and style as well as how to use both geometric and associative markers. This helps build visual and media literacy skills as you need to consider what meanings are associated with icons, colors, images, and base maps.
After making a map or two, you’re beginning to get an idea of the added materials you will need to complete a robust webpage. You will need to collect photos, YouTube videos, URLs, and audio clips from interviews. Start saving them in an orderly folder structure in Google Drive. Once you start having a collection of materials it’s time to iteratively work through the theme on a page and try to get the most production value out of the smallest amount of space.
I conducted this workshop four times: three times at Johannes Gutenberg University of Mainz, and once at the University of Trier. The average amount of time it took to get through this was three hours with a ten-minute break. Some participants took less time by skipping some exercises while others wanted to extend the time to learn more. These are not all the uses that can be done with Google applications; just a handful of them that I use in various academic research and teaching.
One example of a Google Mapping project I require of my students is the “Places in the Media Atlas.” This is a class project that links weekly readings, lectures, and online media to specific topics each week. The class runs seven weeks so there are seven different sections of the Google Site project to complete. Each week students are required to build a section of their Google Site (their Places in the Media Atlas). This project creates a learner-centered activity that reinforces the content of the class, makes them apply geographic media literacy skills, and gives them a tangible outcome of their work (their website).
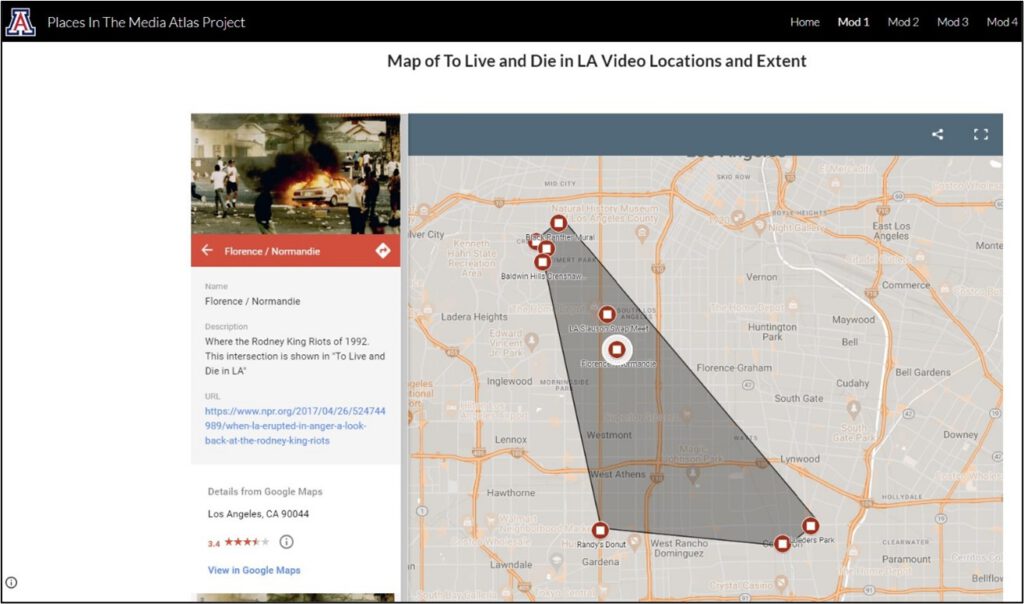
Figure 7: Places in the Media Atlas (Google MyMaps, all images by author)
Conclusion
The Google Mapping Guide promotes geographic media literacy skills, relies only on freeware applications (not all of which are open source), and offers a means to give students the independence to work on projects and share their results on the internet. The guide focuses on information technology that students have had some exposure with allowing for the rate of learning and development to expand exponentially.
However, you should be conscious of privacy issues with Google. Understanding that information shared in any of the Google applications could be used by the company and could be made public is part of information literacy skills. As the online post from Dancanekaya (2023) notes data privacy in information media literacy skills includes seven components: digital footprint and privacy awareness, media manipulation and phishing, social media literacy and privacy settings, data literacy in journalism, cybersecurity in media production, educational initiatives, and regulatory compliance. I would suggest that you and your students create Google accounts for specific projects and keep only limited materials online for those projects. Second, never put personal information in a project Google account. Even with your own Google account, you should be very careful of what information you store online. When a project is no longer being used, delete it so it no longer exists. We should also be critical about using Google products and teaching them to our students as Google thrives on using people’s data for profit. So, limit the amount of personal data given for each project including the personal data of the people shown on your project websites. The idea here is not that we’re promoting Google or Esri or any other large transnational company but rather that we are teaching geographic media literacy skills across platforms that students have some familiarity with allowing them easier access to spatial thinking skills.
What gets me excited about the Google Mapping Guide is making online accessible resources that allow people to create their own websites with maps in a very short time. This is the democratization of mapping at work: quick and easy ways to share spatial ideas and information with one another and the public. I don’t want to take anything away from Esri and StoryMaps, but it is proprietary software and can be expensive. One of the reasons why I developed the Google Mapping Guide was that most people did not have access to Esri software. The goal of the Google Mapping Guide is to get people mapping and sharing ideas and information online: putting the power back in the hands of the individuals to share their spatial knowledge.
Useful Resources
References
Byrne, D., and A. J. Pickard. 2016. Neogeography and the democratization of GIS: A metasynthesis of qualitative research, information, Communication and Society 19:11, 1505-1522. https://doi.org/10.1080/1369118X.2015.1125936
Dancanekaya. 2023. Data Privacy in Media Information Literacy. 29 November 2023. Medium. https://medium.com/@dancanekaya/data-privacy-in-media-information-literacy-713258c252d4. Last Accessed 18 August 2024.
Fansecky, R., and J. Debes. 1972. Visual Literacy: A Way to Learn, a Way to Teach. Washington D.C.: AECT Publications.
Leszczynski, A. 2014. On the Neo in Neogeography, Annals of the Association of American Geographers, 104:1, 60-79. https://doi.org/10.1080/00045608.2013.846159
Lukinbeal, C. 2014. Geographic Media Literacy. Journal of Geography 113(2): 41-46. https://doi.org/10.1080/00221341.2013.846395
Lukinbeal, C. 2018. The Mapping of 500 Days of Summer: A processual approach to cinematic cartography. NECSUS an International Journal of the European Network for Cinema and Media Studies 7(2): 97-120.
Lukinbeal, C., and L. Sharp. 2019. Narrative formula through the geography of Transformers: Age of Extinction. Ed. Stann Brunn. pp. 1-23. In, Changing World Language Map. New York: Springer.
Lukinbeal, C. 2024. Google Mapping and Web Publishing Made Easy or Practicing Cultural Cartography. https://sites.google.com/view/practicingculturalcartography/home. Last Accessed 17 August 2024.
Nylen, L., and A. Edgerton. 2024. US Considers a Rare Antitrust Move: Breaking Up Google. Bloomberg News. 13 August 2024. https://www.bloomberg.com/news/articles/2024-08-13/doj-considers-seeking-google-goog-breakup-after-major-antitrust-win. Last Accessed 17 August 2024.
US Copyright. 2024. https://www.copyright.gov/history/copyright-exhibit/lifecycle/. Last Accessed 29 February 2024.
Leave a Reply